
UK House Prices 2026: Asking vs Sold Prices | Viewber
The UK Property Lens: The ‘In Sync’ Edition
UK House Prices 2026: Asking Prices, Sold Prices and Property Market Trends
Posted October 2026
(This article is taken from the latest edition of The UK Property Lens, Viewber’s LinkedIn newsletter covering property market insights, trends and industry analysis.)
Are UK house prices finally reflecting what buyers are willing to pay?
After months of uncertainty, ambitious asking prices and increasingly cautious buyers, the latest UK property market data suggests sellers and purchasers may finally be finding more common ground.
Viewber’s latest analysis of Rightmove asking prices and HM Land Registry sold prices reveals an interesting shift. Following a dip in December 2025, asking prices in England recovered during the first quarter of 2026, with completed sale prices following a similar upward trajectory.
But the picture isn’t entirely straightforward. Regional differences remain significant, rental yields are attracting investor attention, and rising moving costs are raising questions about whether buying is always preferable to renting.
Here’s what the latest figures reveal about the UK property market in 2026.
UK House Prices 2026: Asking Prices and Sold Prices Move in Sync
Viewber has once again compared six months of average asking prices from the Rightmove House Price Index with completed property sale prices recorded by HM Land Registry.
Our analysis focuses on England, comparing Rightmove asking prices between October 2025 and March 2026 with Land Registry sold prices recorded three months later, between January and June 2026.
The three-month difference allows for a typical period between a property being listed and a sale completing. It provides an indication of how pricing trends develop, although the two datasets do not necessarily represent the same properties.
Rightmove Asking Prices: A Recovery After December’s Dip
Rightmove’s average asking price in England reached £349,282 in December 2025, marking a low point in Viewber’s six-month monitoring period.
However, sellers entered 2026 with renewed confidence.
Average asking prices increased in each of the first three months of the year, reaching £362,054 in March 2026.
This recovery suggests sellers were increasingly optimistic about achievable property values following the uncertainty towards the end of 2025.
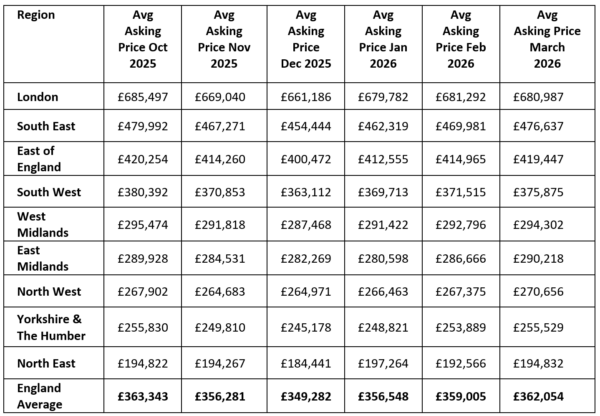
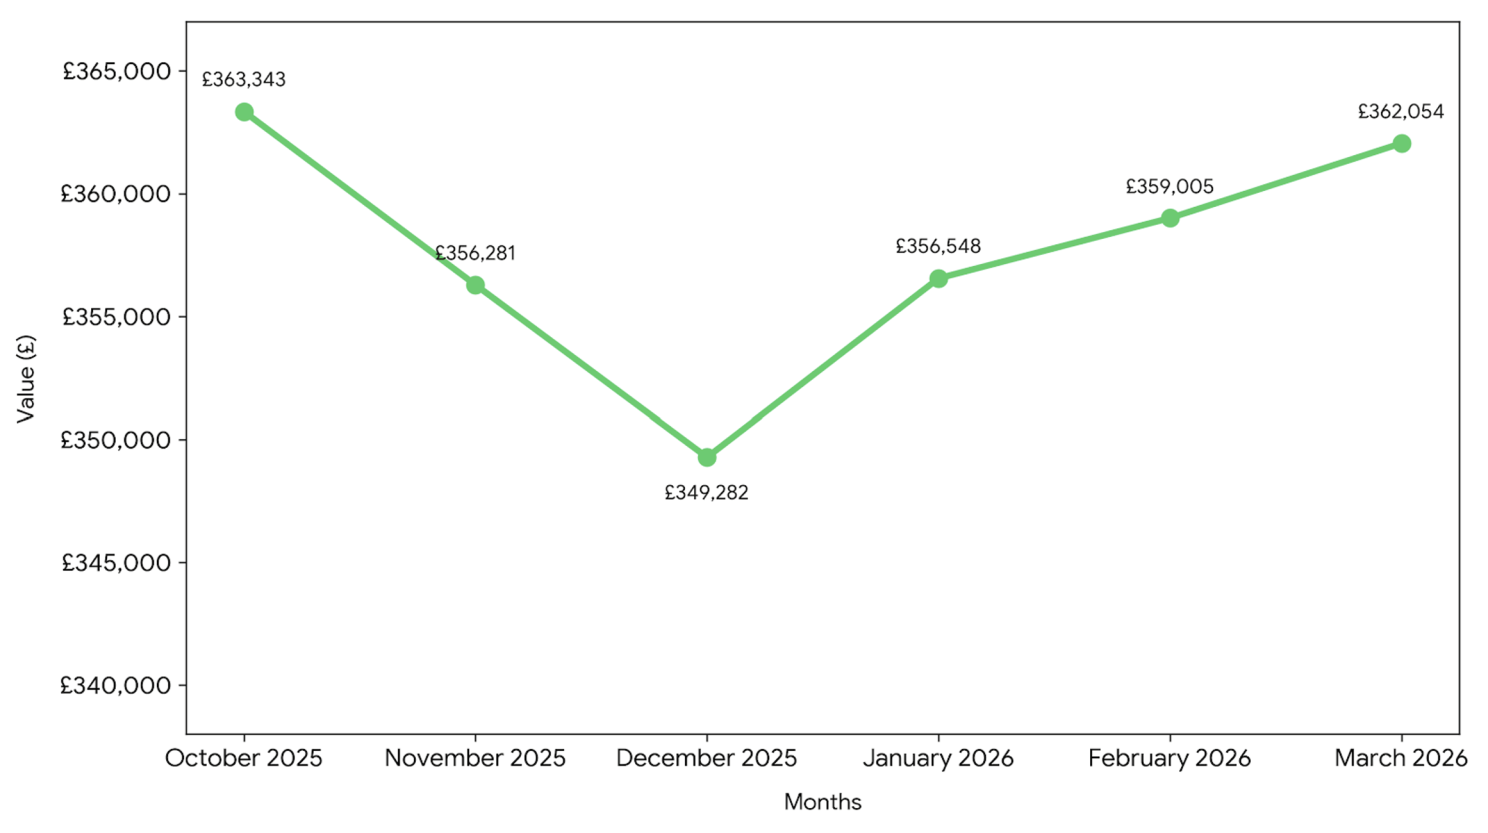
Image caption: Rightmove House Price Index data showing average asking prices in England between October 2025 and March 2026.
Land Registry Sold Prices Follow a Similar Pattern
Completed property sales also showed signs of recovery.
Using Viewber’s three-month comparison period, Land Registry sold prices followed a broadly similar upward trend, reaching a six-month high of £295,889 in June 2026, according to Viewber’s analysis.
This is an encouraging indication that rising asking prices were accompanied by improvements in achieved sale values.
However, asking prices and sold prices measure different aspects of the housing market, so their absolute values should not be interpreted as a direct measure of the discount negotiated by individual buyers.
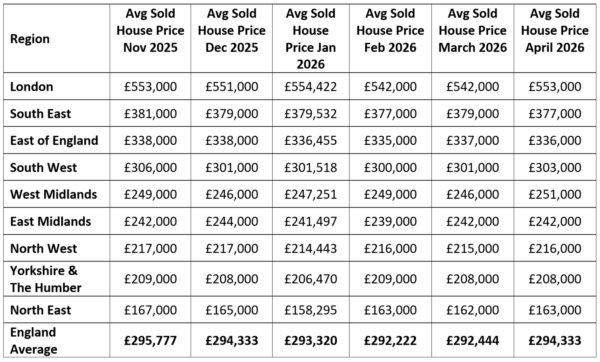
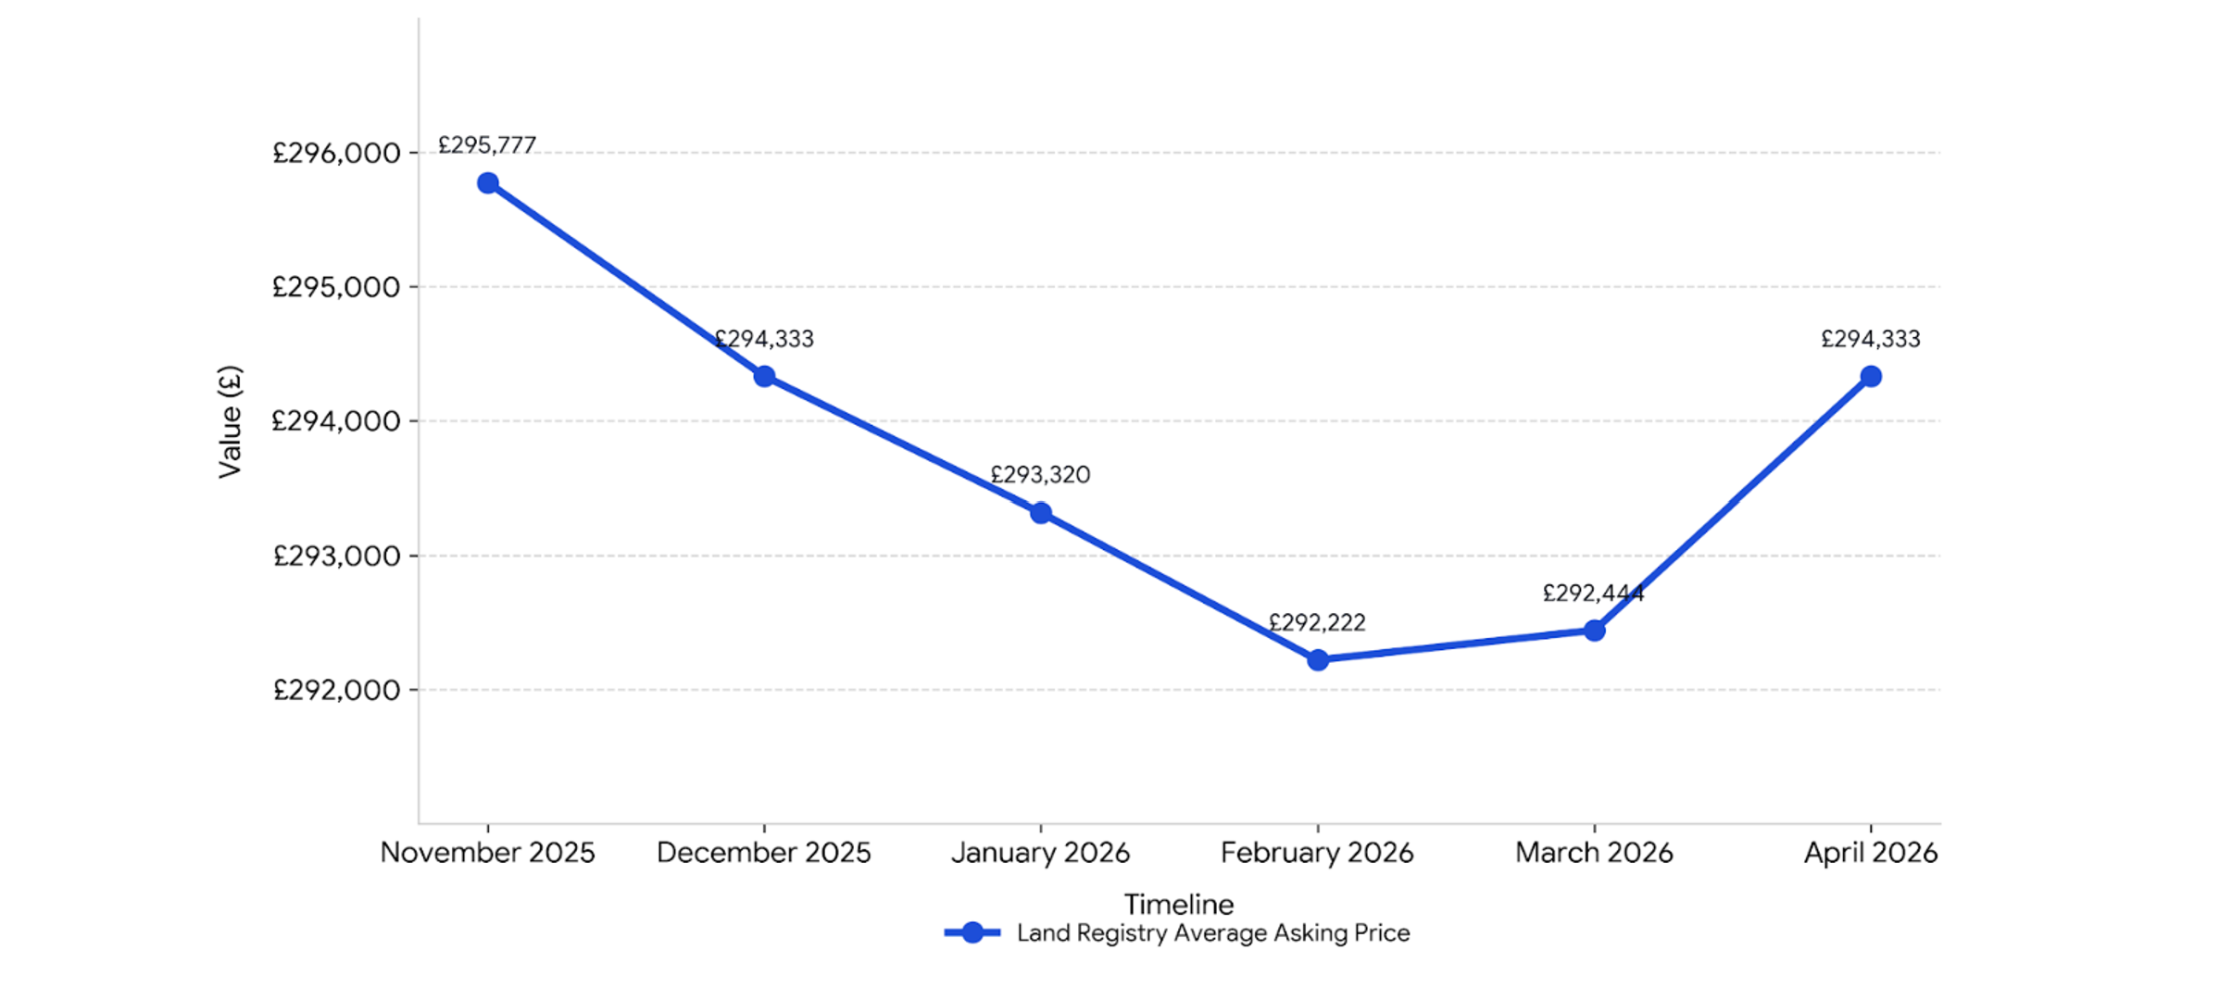
Image caption: HM Land Registry data showing average completed property sale prices in England between January and June 2026.
The Boxing Day Bounce: Did Buyers Match Sellers’ Expectations?
One of the most striking findings from Viewber’s analysis was the increase in asking prices between December 2025 and January 2026.
Average asking prices jumped by £7,266, the largest month-on-month increase in the six-month period.
Yet the corresponding movement in completed sales was considerably more modest.
Between March and April 2026, Land Registry average sold prices increased by just £1,889.
This contrast suggests that although seller confidence recovered quickly, the improvement in completed sale values was less pronounced.
For estate agents, it reinforces an important principle: an ambitious asking price is not necessarily an achievable selling price.
Accurate valuations, realistic vendor expectations and an understanding of local buyer demand remain essential to successful property sales.
Regional House Price Trends: The North East and North West Lead the Way
National averages can disguise substantial differences between regional property markets.
Viewber’s analysis found that only three English regions finished the asking-price monitoring period with higher average values in March 2026 than in October 2025:
- East Midlands
- North West
- North East
Completed sale prices presented a more positive picture. Only London and the East Midlands ended the corresponding January–June 2026 period with lower average sold prices.
Northern Property Markets Show Greater Resilience
The North East and North West were the only two regions to record increases in both average asking prices and average sold prices across Viewber’s monitoring periods.
The increases in completed sale prices were particularly noteworthy:
- North East: £7,705 increase between January and June 2026.
- North West: £5,557 increase over the same period.
This regional resilience reflects the growing importance of northern property markets, where relative affordability and rental investment opportunities continue to attract attention.
For agents, investors and property professionals, it also highlights why local market knowledge matters more than relying on national house price headlines alone.
Are UK House Prices Falling Again?
Although the first quarter of 2026 showed signs of recovery, the summer brought renewed pressure on asking prices.
Rightmove’s August 2026 House Price Index reported a 2% month-on-month fall in the average asking price of newly marketed homes across Great Britain.
This was a larger August decline than typically recorded, suggesting sellers were responding to increased competition and affordability pressures.
Viewber’s analysis also found that England’s average asking price in August was £4,019 below its March 2026 level.
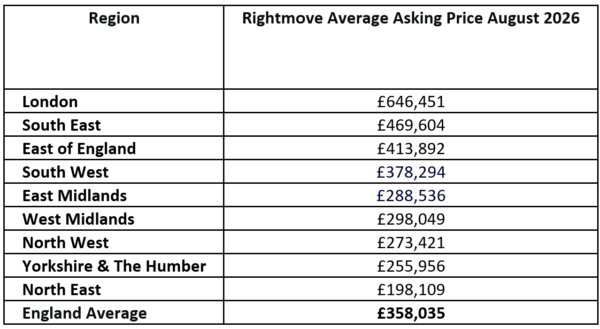
Image caption: Rightmove asking price data illustrating the summer 2026 property market slowdown.
The findings reinforce the importance of realistic asking prices, particularly when buyers have more choice and are carefully assessing affordability.
Buyer Behaviour in 2026: Is the Asking Price Still Too High?
Property market statistics tell one story, but buyer and seller attitudes offer another.
Viewber’s latest polls explored whether asking prices are aligned with buyer expectations.
Sellers Withdrawing From the Market
When asked whether more sellers were withdrawing their properties because they couldn’t achieve their asking price:
- 23% reported a definite increase.
- 46% reported a slight increase.
Combined, 69% of respondents reported some level of increase.
This suggests that the gap between seller expectations and buyer willingness to pay remains a challenge in parts of the market.
Buyers Expect to Negotiate
Viewber also asked whether a buyer’s first offer should always be below the asking price.
The most popular response, selected by 40% of respondents, was ‘yes, always’.
Meanwhile, 35% of respondents said they always checked whether a property’s asking price had been reduced, with a further 39% checking sometimes.
Together, 74% indicated that they monitor price reductions at least occasionally.
These findings suggest that price changes are an important part of the buyer decision-making process.
For estate agents, communicating the reasoning behind a valuation and responding promptly to changing market conditions could make the difference between a successful sale and a property remaining unsold.
Viewber poll results reflect the views of respondents and should not be interpreted as a nationally representative survey.
Buyer Demand Shows Signs of Recovery
Despite pricing pressures, there have been encouraging signs for the wider housing market.
Rightmove reported a 5% improvement in buyer demand in August 2026, while Zoopla’s property market research noted a 7% increase in property searches.
Reduced uncertainty around potential property tax changes may have encouraged some prospective movers to resume their searches.
However, increased search activity doesn’t automatically translate into completed transactions.
Affordability, mortgage costs and realistic asking prices remain important influences on whether buyers proceed.
For estate agents, the challenge is converting renewed interest into viewings, offers and completed sales.
Having access to reliable property viewing and open house services can help agents accommodate buyers, including during evenings and weekends.
Homeowners Are Staying Put for Longer
Another significant trend shaping the UK property market is the increasing length of time homeowners remain in their properties.
Research cited by Connells Group, based on Land Registry data, found that the average seller in 2026 had owned their property for 12.3 years, compared with 9.2 years a decade earlier.
The proportion of homeowners selling after shorter ownership periods has also declined.
Only 5% of sellers had owned their property for fewer than three years, compared with 15% in 2006.
Similarly, the proportion selling within five years fell from 29% in 2006 to 14% in 2026.
The Risk of Selling at a Loss
Perhaps more striking is the proportion of recent buyers who have sold for less than they originally paid.
According to the research:
- 20% of sellers who had owned their property for five years or less sold at a loss in 2026.
- 23% of those selling within three years made a loss.
- Approximately 32% of properties originally purchased for £1 million or more were estimated to be worth less than their purchase price.
These findings underline the importance of considering the full costs of homeownership, particularly when purchasing with a relatively short time horizon.
They also help explain why some homeowners may be reluctant to move, even when their circumstances change.
UK Property Transactions: A Slower-Moving Market
HM Revenue & Customs property transaction statistics provide further context.
The provisional seasonally adjusted estimate of UK residential property transactions in July 2026 was 96,710.
This represented a 1% decrease compared with July 2025 and a 2% fall compared with June 2026.
Although property prices and buyer demand fluctuate, lower transaction volumes can create operational challenges for estate agents and property businesses.
In a market where activity is less predictable, the ability to scale resources according to demand becomes increasingly valuable.
UK Rental Market 2026: Rents and Yields Continue to Rise
While the sales market faces affordability challenges, the UK rental market continues to show resilience.
According to the HomeLet Rental Index, the average monthly rent for a newly agreed tenancy reached £1,382 in August 2026.
That represented:
- A 0.9% increase over four weeks.
- A 4.1% increase compared with August 2025.
For tenants, rising rental costs create additional affordability pressures.
For landlords, stronger rental income can help support investment returns, although maintenance, financing, taxation and regulatory costs must also be considered.
Average Buy-to-Let Rental Yields Reach 7.8%
Fleet Mortgages’ Buy-to-Let Rental Barometer reported that average gross rental yields across England and Wales reached 7.8% in Q2 2026.
This represented an increase of 0.3 percentage points compared with Q2 2025.
The figures suggest that rental income remains an important consideration for property investors, particularly in areas where purchase prices are relatively affordable.
Best Areas for Buy-to-Let Rental Yields in 2026
Northern England continues to stand out for rental investment performance.
Fleet Mortgages identified the following regional gross rental yields:
| Region | Average rental yield |
|---|---|
| North East | 9.2% |
| North West | 8.8% |
| Yorkshire & The Humber | Above 8% |
| England and Wales average | 7.8% |
Zoopla’s property market analysis in March 2026 also highlighted several northern locations offering attractive gross rental yields.
Sunderland led the English city rankings at 9.3%, followed by Burnley at 8.2% and Middlesbrough at 8.1%.
The combination of relatively affordable property prices, rental demand and resilient regional house prices may encourage landlords to reconsider where they invest.
However, gross yields do not account for mortgage payments, void periods, property management, maintenance or tax liabilities.
For landlords managing properties across different regions, access to reliable property visits and checks can help maintain oversight without unnecessary travel.
Stamp Duty vs Renting: Are Moving Costs Changing the Market?
At the higher end of the property market, the cost of buying can be substantial.
Stamp Duty Land Tax (SDLT) is a particularly significant consideration for purchasers of expensive properties in England.
To illustrate the scale of the expense, Viewber compared example stamp duty liabilities with average local rental costs.
Kensington & Chelsea: Nearly 28 Years of Rent?
Consider a £15.95 million townhouse in Kensington Court, London.
For an eligible buyer purchasing the property as their only home, the standard stamp duty liability would be £1,827,750.
According to London Assembly figures cited in Viewber’s analysis, the average monthly rent for a property with four or more bedrooms in Kensington & Chelsea was £5,555.
On that basis, the stamp duty bill alone is equivalent to approximately 329 months of rent, or more than 27 years.
St Albans: Over 13 Years of Rent
A family home priced at £3,875,000 in St Albans would carry a standard stamp duty liability of £378,750.
With average monthly rents of £2,307, as cited by Rightmove, the stamp duty cost would be equivalent to approximately 164 months of rent.
That’s more than 13 years.
Stroud: Almost Two and a Half Years of Rent
Even at a lower purchase price, moving costs can be significant.
An £800,000 home in Stroud, Gloucestershire, would carry a standard stamp duty liability of £30,000.
Using an average monthly rent of £1,040, based on Office for National Statistics rental data, the stamp duty bill is equivalent to almost 29 months of rent.
These comparisons illustrate the scale of upfront purchasing costs. They are not direct rent-versus-buy affordability calculations, as they exclude mortgage costs, equity accumulation, maintenance, investment returns and future changes in property values.
Could a Mansion Tax Affect Prime London Property?
Potential changes to property taxation have also raised questions about the future of the prime property market.
Proposals and speculation surrounding an additional annual charge on homes worth more than £2 million could influence decisions among higher-value homeowners and prospective purchasers.
A potential annual liability of between £2,500 and £7,500 has been discussed, although any final policy would depend on government announcements and legislation.
For some buyers, additional ongoing costs could make renting a more attractive short-term option.
But the implications could extend beyond the luxury housing market.
Why Prime Central London Matters to the Wider UK Property Market
Ed Mead, Founding Director of Viewber, believes the performance of Prime Central London has wider consequences for the property sector.
He argues that high-value property transactions can influence confidence and movement further down the housing chain.
In his view, aspirational purchases in locations such as Chelsea and Knightsbridge have historically helped encourage movement throughout other parts of the London market.
When confidence at the top end weakens, the effects can spread to other property price brackets, reducing the incentive or ability for homeowners to move.
His concern is that rising transaction costs, policy uncertainty and reduced confidence among high-value buyers could contribute to a less active housing market.
The relationship is complex, but it raises an important question: could reduced movement at the top of the market have consequences for the wider property chain?
What Does the UK Property Market Outlook Mean for 2026?
Viewber’s latest analysis points towards a market in which asking prices and completed sale prices have shown greater alignment, but where affordability remains a defining challenge.
Several themes stand out.
Realistic pricing remains essential. Sellers may be regaining confidence, but buyers continue to scrutinise asking prices and monitor reductions.
Regional performance is increasingly important. The North East and North West have shown resilience in both property values and rental investment returns.
Transaction costs influence moving decisions. Stamp duty and the wider cost of moving may be contributing to longer ownership periods and more cautious buyer behaviour.
Landlords are focused on rental returns. Rising rents and stronger yields in selected northern markets continue to create opportunities, although investment costs must be carefully assessed.
Flexibility matters for property businesses. With transaction volumes and buyer demand fluctuating, estate agents, landlords and property managers need reliable ways to respond to changing workloads.
Supporting Property Professionals Across the UK
As the UK property market evolves, efficiency, flexibility and a consistent customer experience remain essential.
Viewber provides nationwide, on-demand property support, helping estate agents, landlords, property managers and other property professionals manage appointments and property-related tasks without the need for additional permanent staffing.
From hosted property viewings to property visits and checks, Viewber helps businesses respond to changing workloads while maintaining customer service standards.
Landlords and investors can also explore Viewber’s landlord checking services.
Frequently Asked Questions About UK House Prices in 2026
Are UK house prices rising or falling in 2026?
Property prices have varied by region and month. Viewber’s analysis found a recovery in asking and sold prices during the first half of 2026, followed by renewed pressure on asking prices during the summer.
What is the difference between asking prices and sold prices?
An asking price is the amount a seller advertises a property for. A sold price is the amount recorded when a property transaction completes. Comparing market-wide averages can reveal trends, but doesn’t establish the discount achieved on individual homes.
Which UK regions have the strongest rental yields in 2026?
The North East and North West feature prominently in Viewber’s research, with reported average gross yields of 9.2% and 8.8% respectively.
Stay Ahead With The UK Property Lens
The UK property market never stands still, and neither does our analysis.
The UK Property Lens brings together property market data, industry research, Viewber insights and expert commentary to explore the trends shaping residential sales, lettings and investment.
From asking prices and completed sales to regional rental yields and changing buyer behaviour, our newsletter helps property professionals stay informed.
Want more UK property market insights?
Subscribe to The UK Property Lens on LinkedIn to receive future editions and stay ahead of the trends influencing the property sector.
Read the previous edition: The UK Property Lens: The ‘Great Expectations’ Edition
Data and methodology: Viewber’s asking-price analysis uses Rightmove House Price Index figures for England between October 2025 and March 2026. Sold-price comparisons use HM Land Registry data for January to June 2026, with a three-month offset. These datasets are not matched individual property transactions. Sold-price figures may include open-market, cash and auction sales. Market data and survey findings are attributed to their respective sources. Figures reflect the periods stated and may subsequently be revised.